
Explainer · Election-week series · For the Mon Nov 2
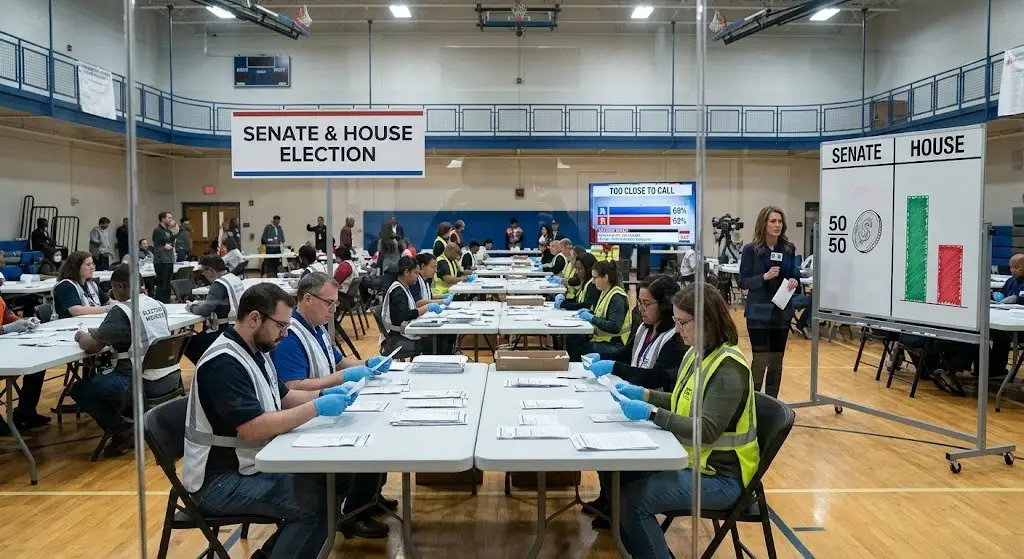
Tomorrow, voters decide control of both chambers of Congress. The headline numbers point in the same direction in both — Democrats favored — but the races are not equally close. Every source makes the House look like a strong Democratic favorite. The Senate is a genuine coin flip with a Democratic lean, depending on which forecaster you trust. Understanding why the chambers differ is key to reading Tuesday night.
The Senate math: four seats, seven races
Republicans hold the Senate 53–47, counting the two independents who caucus with Democrats. Thirty-five seats are on the ballot: 22 Republican-held, 13 Democratic-held (33 regular seats plus special elections in Ohio and Florida).
Democrats need a net gain of four seats to reach 51. A 50–50 tie would keep the Senate in Republican hands because Vice President JD Vance breaks ties. Republicans can lose a net three seats and still keep control.
The nonpartisan Cook Political Report’s October 20 ratings narrow the fight to seven toss-up races: six held by Republicans — Alaska, Iowa, Kansas, Maine, Ohio, and Texas — and one held by Democrats, Michigan. Cook estimates Democrats could gain two to six Senate seats. Four is the number that matters and sits squarely inside that range.
The Democratic path, as the ratings lay it out, has three steps. First, hold what they have: Michigan (the toss-up), plus Georgia (Likely Democratic) and Minnesota and New Hampshire (both Lean Democratic). Second, flip North Carolina, rated Likely Democratic, where former governor Roy Cooper leads Republican Michael Whatley and prediction markets price Cooper at about 97%. Third, win three of the six Republican-held toss-ups. That is the whole ballgame: North Carolina plus three.
The seven toss-ups, race by race
Each of these races is within about four points in the newest public polls. A short tour:
Texas (open): Democrat James Talarico vs. Republican Ken Paxton. A University of Houston Hobby School poll (Oct 10–14, 2,000 likely voters) had Talarico ahead 48–46. Markets price Talarico at about 65%.
Ohio (special): Former Democratic senator Sherrod Brown vs. appointed Republican senator Jon Husted, for the remaining two years of the term. Rasmussen (Oct 12–14) had Husted ahead 49–47. Markets price the Democrat at about 66%.
Maine: Democratic challenger Troy Jackson vs. Republican incumbent Susan Collins. A Fox News poll (Oct 16–20) had them tied 49–49. Markets price Jackson at about 66%.
Michigan (open): Democrat Abdul El-Sayed vs. Republican Mike Rogers. The one Democratic-held toss-up — the seat Democrats can least afford to lose.
Alaska: Democrat Mary Peltola vs. Republican incumbent Dan Sullivan. Forecasters are split: Sabato rates it Leans Democratic, Cook calls it a toss-up, and Inside Elections leans Republican.
Iowa (open): Democrat Josh Turek vs. Republican Ashley Hinson. About as tied as a race gets: Hinson leads the polling average by just 0.1 points, and markets give her about a 57–59% chance.
Kansas: Democrat Adam Hamilton vs. Republican incumbent Roger Marshall. Markets favor Marshall at about 61% — the most Republican-leaning of the toss-ups.
Notice the shape: markets favor Democrats in four of the six Republican-held toss-ups they price (Maine, Ohio, Texas, plus Michigan on the Democratic side) and Republicans in Kansas and Iowa. If that pattern holds, Democrats would land almost exactly on four net gains. Almost exactly is not a comfortable margin.
Why the forecasters disagree — and why that disagreement is the story
Here the numbers get interesting because honest forecasters do not agree with each other:
Decision Desk HQ (checked Nov 1): Democrats 63% to win the Senate, projected 52 seats.
The Economist (Oct 29): Democrats 53% — its lowest reading since September 10.
Nate Silver’s model (Oct 31): Democrats 79% — up from 75%, after what Silver called very strong Democratic polls in individual Senate races over the past couple of days.
Prediction markets (Oct 30): Polymarket and Kalshi both about 68%.
The spread — 53% to 79% — is not a mistake. Models and markets measure different things. Models blend polls with fundamentals like the national environment and each state’s partisan lean; they move slowly. Markets react to every new poll and headline within minutes; they move fast and sometimes overshoot. Each of these numbers is a probability, not a prediction. A 63% chance means the same outcome fails nearly four times in ten in the model’s simulated worlds.
There is also a known fragility worth stating plainly. Polls have overstated Democrats in recent cycles — notably 2016 and 2020. Silver’s model notes that if this year’s polls overstate Democrats by three or four points, the Democratic Senate chance falls to about 38%. CNN’s October 29 range of plausible outcomes runs from 49 to 55 Democratic seats — spanning both parties winning. That is what a coin flip looks like in numbers.
The House: a different map, a different story
Now the contrast. All 435 House seats are up, and the House math starts from a narrower Republican edge: 218 Republicans, 214 Democrats, one independent who caucuses with Republicans, and two vacancies. Democrats need a net gain of four seats to reach 218.
Every source makes them strong favorites to reach that goal:
Prediction markets (Oct 30): Polymarket about 93%, Kalshi about 92%.
Decision Desk HQ (checked Nov 1): Democrats 83%, projected 241 seats.
Cook Political Report (Oct 23): Democrats favored outright in the 218 seats needed for a majority, with a projected gain of 12 to 22 seats.
The national environment: the generic congressional ballot averages Democrats +8.3 — 51.5% to 43.2% across 45 polls ending October 27.
Why is the House so much less close than the Senate? Because the maps are different. The House is fought across dozens of competitive districts, and a national D+8 environment lifts nearly all at once. The Senate is fought in seven states, each with its own candidates, polls, and quirks. Democrats need to thread the needle in nearly all of them. A wave big enough to flip the House comfortably can still fall one seat short in the Senate. That is exactly what the current numbers describe.
What to watch on election night
If you are watching returns Tuesday, watch in this order. North Carolina first: it is the likeliest Democratic flip, and if it does not flip, the Democratic path to four narrows to almost nothing. Michigan second: the Democratic-held toss-up they must hold. Then Maine, Ohio, and Texas: the three Republican-held toss-ups where markets favor Democrats. Winning all three plus North Carolina is the fourth. Kansas and Iowa last: the two toss-ups where Republicans are favored. If Democrats take one of those, the night is breaking their way. If Republicans hold both, Democrats need a clean sweep everywhere else.
The bottom line
The Senate is a coin flip with a Democratic lean in the markets and a true toss-up in the models. The House is a strong Democratic favorite in every source. Both statements can be true at once because the chambers are decided on different maps. Neither statement is a result: forecasts are probabilities, polls have missed before, and seven races within four points will decide the Senate. The numbers say what is likely. Tuesday says what happened.
Explainer, neutral: no candidate endorsement, no position-taking — analysis of ratings, polls, models, and markets only. Figures refreshed Nov 1, 2026: Cook Senate ratings Oct 20 and House ratings Oct 23; Decision Desk HQ forecasts as shown on its forecast page Nov 1 (Senate 63% / 52 seats, House 83% / 241 seats); Silver 79% (Oct 31, up from 75%); prediction-market prices Oct 30; generic-ballot average across 45 polls ending Oct 27. Forecasts move daily; re-check at publication time if the piece slips past Nov 2.
Mark Evans
Moderate Voices of America (MVA)
30 Wall Street, 8th Floor
New York, New York 10005
212 608 -1999
www.moderatevices.org